一、什么是图像直方图

  图像直方图是图像像素值的统计学特征、计算代价较小,具有图像平移、旋转、缩放不变性等众多优点,广泛地应用于图像处理的各个领域,特别是灰度图像的阈值分割、基于颜色的图像检索以及图像分类、反向投影跟踪。常见的分为灰度直方图和颜色直方图。

  简单来说,图像对计算机来说就是一个一个像素点的数值,像素值又有一定的取值范围,所以我们可以统计出来这些像素值出现的频率,统计结果就是一个直方图。

  对图像进行平移、旋转等操作后,图像的直方图信息不会变化。因此即使两张图像的直方图完全一样,图像有可能不是同一个图像。

二、如何计算图像直方图

OpenCV中提供了如下的函数用于计算图像的直方图:

1
2
3
4
5
6
7
8
9
10
11
12
void calcHist(
const Mat* images, //源图像组
int nimages, //源图像组图像个数
const int* channels, //图像信道
InputArray mask, //可选的掩码,如果不为空,则必须是8-bit数组,而且大小和原图像相同
OutputArray hist, //输出直方图数组
int dims, //处理直方图的维数正数
const int* histSize, //每一维的直方图的尺寸大小
const float** ranges, //直方图每一维的数据大小范围
bool uniform=true,
bool accumulate=false
);

示例程序如下:

1
2
3
4
5
6
7
8
9
10
11
12
13
14
15
16
17
18
19
20
21
22
23
24
25
26
27
28
29
30
31
32
33
34
35
36
37
38
39
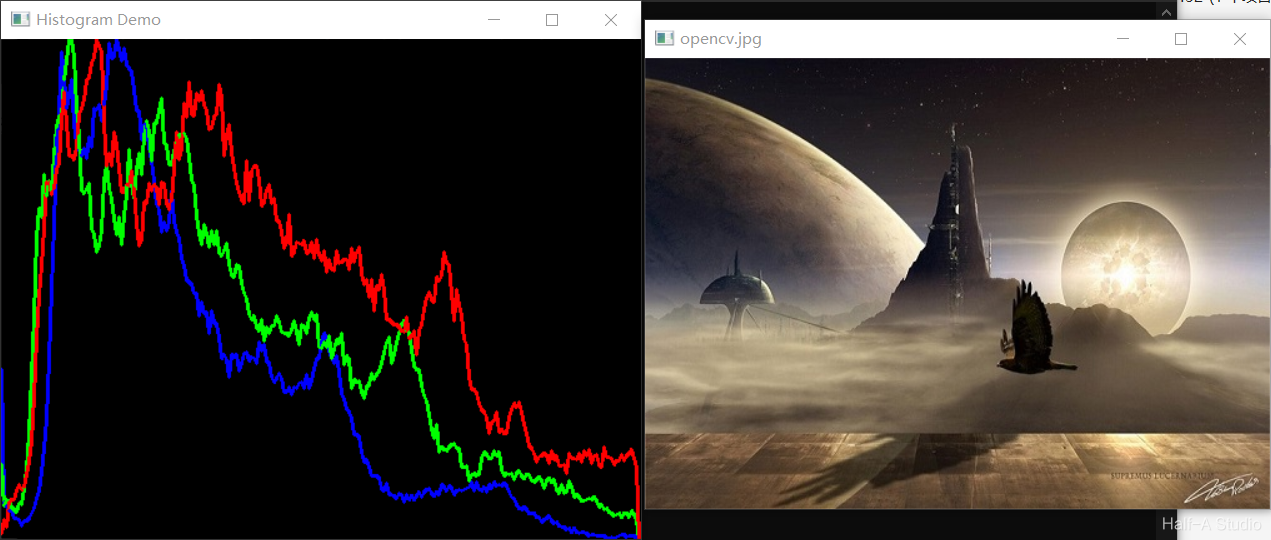
void MyDemo::histShow_Demo(Mat& image) {
// 三通道分离,用于分别绘制三个通道的直方图
std::vector<Mat> bgr_plane;
split(image, bgr_plane);
// 定义参数变量
const int channels[1] = { 0 };
const int bins[1] = { 256 };
float hranges[2] = { 0,255 };
const float* ranges[1] = { hranges };
Mat b_hist;
Mat g_hist;
Mat r_hist;
// 计算Blue, Green, Red通道的直方图
calcHist(&bgr_plane[0], 1, 0, Mat(), b_hist, 1, bins, ranges);
calcHist(&bgr_plane[1], 1, 0, Mat(), g_hist, 1, bins, ranges);
calcHist(&bgr_plane[2], 1, 0, Mat(), r_hist, 1, bins, ranges);

// 显示直方图
int hist_w = 512;
int hist_h = 400;
int bin_w = cvRound((double)hist_w / bins[0]);
Mat histImage = Mat::zeros(hist_h, hist_w, CV_8UC3);
// 归一化直方图数据
normalize(b_hist, b_hist, 0, histImage.rows, NORM_MINMAX, -1, Mat());
normalize(g_hist, g_hist, 0, histImage.rows, NORM_MINMAX, -1, Mat());
normalize(r_hist, r_hist, 0, histImage.rows, NORM_MINMAX, -1, Mat());
// 绘制直方图曲线
for (int i = 1; i < bins[0]; i++) {
line(histImage, Point(bin_w * (i - 1), hist_h - cvRound(b_hist.at<float>(i - 1))),
Point(bin_w * (i), hist_h - cvRound(b_hist.at<float>(i))), Scalar(255, 0, 0), 2, 8, 0);
line(histImage, Point(bin_w * (i - 1), hist_h - cvRound(g_hist.at<float>(i - 1))),
Point(bin_w * (i), hist_h - cvRound(g_hist.at<float>(i))), Scalar(0, 255, 0), 2, 8, 0);
line(histImage, Point(bin_w * (i - 1), hist_h - cvRound(r_hist.at<float>(i - 1))),
Point(bin_w * (i), hist_h - cvRound(r_hist.at<float>(i))), Scalar(0, 0, 255), 2, 8, 0);
}
// 显示直方图
namedWindow("Histogram Demo", WINDOW_AUTOSIZE);
imshow("Histogram Demo", histImage);
}

三、二维直方图

  我们知道RGB虽然有三个通道,但转到HSV色彩空间中只有H和S表示颜色,而V表示亮度。因此要表示一个图像的颜色只有两个维度H和S,因此可以组成一个平面的直方图形式。

  二维直方图的计算调用函数与一维直方图相同,使用的方法如下:

1
2
3
4
5
6
7
8
9
10
11
12
13
14
15
16
17
18
19
20
21
22
23
24
25
26
27
28
29
30
31
void MyDemo::histShow2_Demo(Mat& image) {
// 2D 直方图
Mat hsv, hs_hist;
cvtColor(image, hsv, COLOR_BGR2HSV); //RGB转HSV
int hbins = 30, sbins = 32; //设置二维直方图的直方个数
int hist_bins[] = { hbins, sbins };
float h_range[] = { 0, 180 }; //H:0-180
float s_range[] = { 0, 256 }; //S:0-256
const float* hs_ranges[] = { h_range, s_range };
int hs_channels[] = { 0, 1 }; //选择通道0和通道1
calcHist(&hsv, 1, hs_channels, Mat(), hs_hist, 2, hist_bins, hs_ranges, true, false);

//进行归一化
double maxVal = 0;
minMaxLoc(hs_hist, 0, &maxVal, 0, 0); //找到最大值
int scale = 10;
Mat hist2d_image = Mat::zeros(sbins * scale, hbins * scale, CV_8UC3);
for (int h = 0; h < hbins; h++) {
for (int s = 0; s < sbins; s++)
{
float binVal = hs_hist.at<float>(h, s);
int intensity = cvRound(binVal * 255 / maxVal);
rectangle(hist2d_image, Point(h * scale, s * scale),
Point((h + 1) * scale - 1, (s + 1) * scale - 1),
Scalar::all(intensity),
-1);
}
}
applyColorMap(hist2d_image, hist2d_image, COLORMAP_JET);
imshow("H-S Histogram", hist2d_image);
}